Pipeline Forecast
Summary
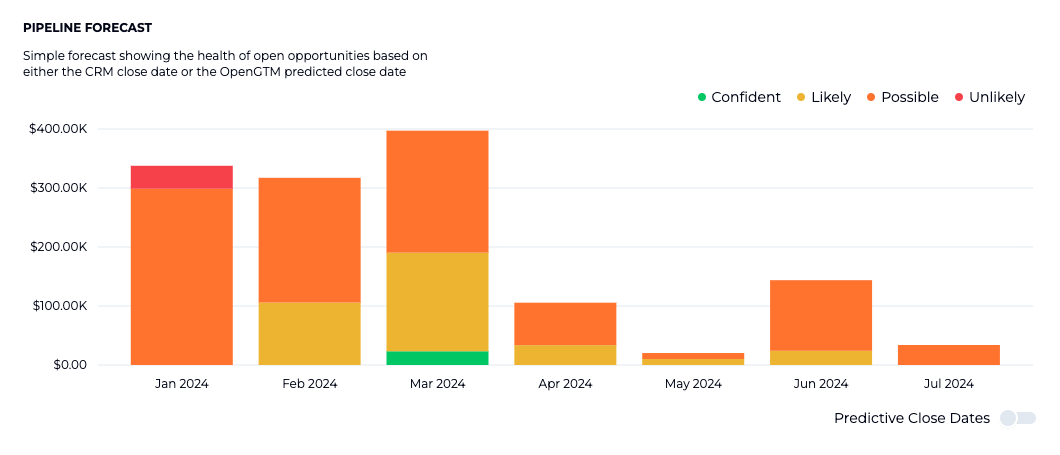
The pipeline forecast has two key views. The default view shows when the CRM amounts are expected to close using the CRM close dates, broken out by confidence level using the repeat buyer potential scores. Toggling predictive close dates uses the OpenGTM predicted close dates instead of the CRM close dates. This allows you to compare timelines of when revenue is expected.
Predicted Close Dates
For each open opportunity a predicted close date is generated. This date is predicated using a calculation for days open, which takes the difference between the close date and the created date. Closed opportunities are analyzed using machine learning to predict the days open opportunities will be open for.
Confidence Levels
- Confident: Opportunities with a Repeat Buyer Potential score greater than 75
- Likely: Opportunities with a Repeat Buyer Potential score between 75 and 50
- Possible: Opportunities with a Repeat Buyer Potential score between 50 and 25
- Unlikely: Opportunities with a Repeat Buyer Potential score of 25 and below
Things to Consider
Currently, this chart does not factor in time series forecasting predictions, which means that seasonality and surprise revenue are not included.